- class sdr.Interpolator(sdr.FIR)
Implements a polyphase finite impulse response (FIR) interpolating filter.
Notes
The polyphase interpolating filter is equivalent to first upsampling the input signal \(x[n]\) by \(r\) (by inserting \(r-1\) zeros between each sample) and then filtering the upsampled signal with the prototype FIR filter with feedforward coefficients \(h_{i}\).
Instead, the polyphase interpolating filter first decomposes the prototype FIR filter into \(r\) polyphase filters with feedforward coefficients \(h_{i, j}\). The polyphase filters are then applied to the input signal \(x[n]\) in parallel. The output of the polyphase filters are then commutated to produce the output signal \(y[n]\). This prevents the need to multiply with zeros in the upsampled input, as is needed in the first case.
Polyphase 2x Interpolating FIR Filter Block Diagram¶+------------------------+ +-->| h[0], h[2], h[4], h[6] |--> ..., y[2], y[0] | +------------------------+ ..., x[1], x[0] --+ | +------------------------+ +-->| h[1], h[3], h[5], 0 |--> ..., y[3], y[1] +------------------------+ Input Hold Output Commutator (top-to-bottom) x[n] = Input signal with sample rate fs y[n] = Output signal with sample rate fs * r h[n] = Prototype FIR filterThe polyphase feedforward taps \(h_{i, j}\) are related to the prototype feedforward taps \(h_i\) by
\[h_{i, j} = h_{i + j r} .\]Examples
Create an input signal to interpolate.
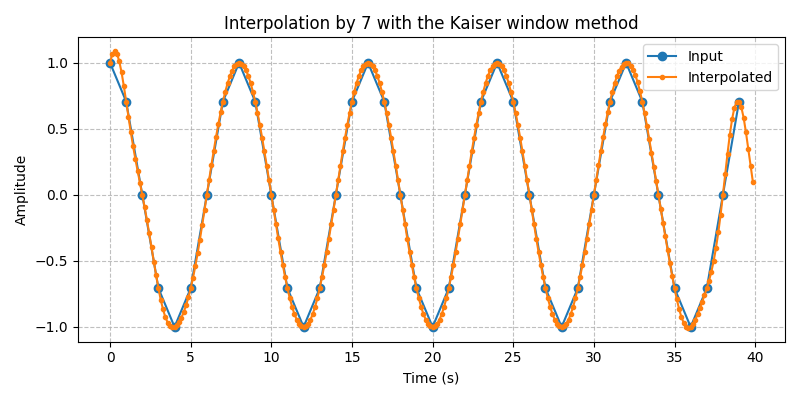
In [1]: x = np.cos(np.pi / 4 * np.arange(40))Create a polyphase filter that interpolates by 7 using the Kaiser window method.
In [2]: fir = sdr.Interpolator(7); fir
Out[2]: sdr.Interpolator(7, 'kaiser', streaming=False)

In [3]: y = fir(x)

In [4]: plt.figure(figsize=(8, 4)); \
   ...: sdr.plot.time_domain(x, marker="o", label="Input"); \
   ...: sdr.plot.time_domain(y, sample_rate=fir.rate, marker=".", label="Interpolated"); \
   ...: plt.title("Interpolation by 7 with the Kaiser window method"); \
   ...: plt.tight_layout();
   ...:
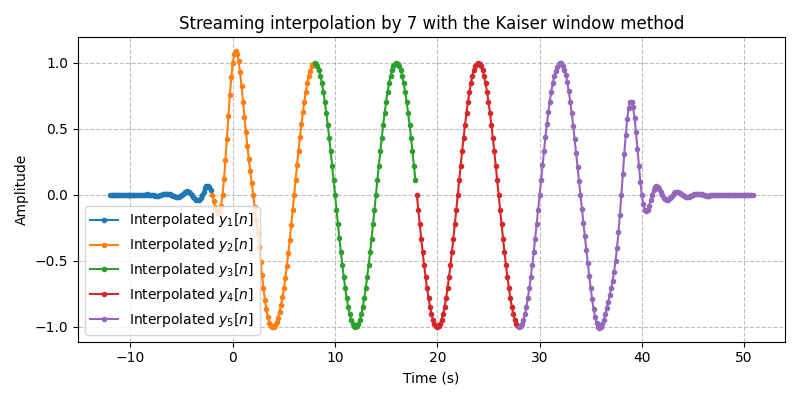
Create a streaming polyphase filter that interpolates by 7 using the Kaiser window method. This filter preserves state between calls.
In [5]: fir = sdr.Interpolator(7, streaming=True); fir
Out[5]: sdr.Interpolator(7, 'kaiser', streaming=True)

In [6]: y1 = fir(x[0:10]); \
   ...: y2 = fir(x[10:20]); \
   ...: y3 = fir(x[20:30]); \
   ...: y4 = fir(x[30:40]); \
   ...: y5 = fir.flush()
   ...:

In [7]: plt.figure(figsize=(8, 4)); \
   ...: sdr.plot.time_domain(y1, sample_rate=fir.rate, offset=-fir.delay/fir.rate + 0, marker=".", label="Interpolated $y_1[n]$"); \
   ...: sdr.plot.time_domain(y2, sample_rate=fir.rate, offset=-fir.delay/fir.rate + 10, marker=".", label="Interpolated $y_2[n]$"); \
   ...: sdr.plot.time_domain(y3, sample_rate=fir.rate, offset=-fir.delay/fir.rate + 20, marker=".", label="Interpolated $y_3[n]$"); \
   ...: sdr.plot.time_domain(y4, sample_rate=fir.rate, offset=-fir.delay/fir.rate + 30, marker=".", label="Interpolated $y_4[n]$"); \
   ...: sdr.plot.time_domain(y5, sample_rate=fir.rate, offset=-fir.delay/fir.rate + 40, marker=".", label="Interpolated $y_5[n]$"); \
   ...: plt.title("Streaming interpolation by 7 with the Kaiser window method"); \
   ...: plt.tight_layout();
   ...:
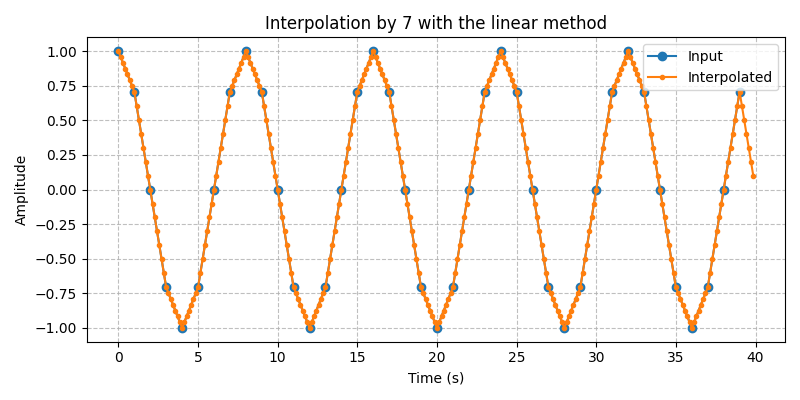
Create a polyphase filter that interpolates by 7 using linear method.
In [8]: fir = sdr.Interpolator(7, "linear"); fir
Out[8]: sdr.Interpolator(7, 'linear', streaming=False)

In [9]: y = fir(x)

In [10]: plt.figure(figsize=(8, 4)); \
   ....: sdr.plot.time_domain(x, marker="o", label="Input"); \
   ....: sdr.plot.time_domain(y, sample_rate=fir.rate, marker=".", label="Interpolated"); \
   ....: plt.title("Interpolation by 7 with the linear method"); \
   ....: plt.tight_layout();
   ....:
Create a polyphase filter that interpolates by 7 using the zero-order hold method. It is recommended to the
"full"convolution mode. This way the first upsampled symbol has \(r\) samples.In [11]: fir = sdr.Interpolator(7, "zoh"); fir Out[11]: sdr.Interpolator(7, 'zoh', streaming=False) In [12]: y = fir(x, mode="full") In [13]: plt.figure(figsize=(8, 4)); \ ....: sdr.plot.time_domain(x, marker="o", label="Input"); \ ....: sdr.plot.time_domain(y, sample_rate=fir.rate, offset=-fir.delay/fir.rate, marker=".", label="Interpolated"); \ ....: plt.title("Interpolation by 7 with the zero-order hold method"); \ ....: plt.tight_layout(); ....: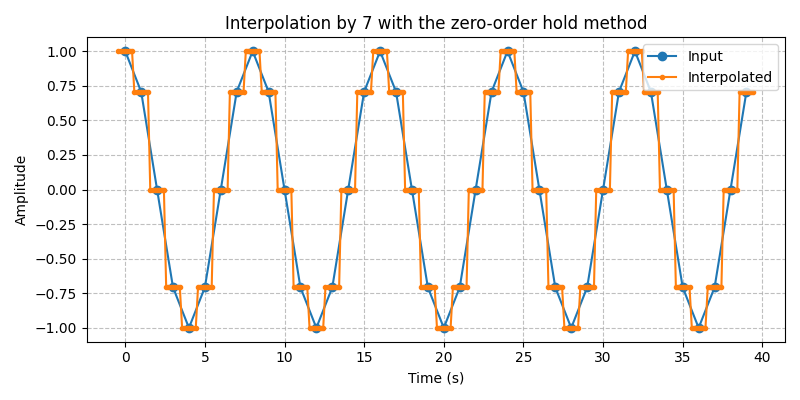
Constructors
- Interpolator(rate: int, ...)
Creates a polyphase FIR interpolating filter.
Special methods
-
__call__(x: ArrayLike, mode: 'rate' | 'full' =
'rate') ndarray Interpolates and filters the input signal \(x[n]\) with the polyphase FIR filter.
String representation
Streaming mode only
- reset()
Resets the filter state. Only useful when using streaming mode.
- flush() ndarray
Flushes the filter state by passing zeros through the filter. Only useful when using streaming mode.
Methods
-
impulse_response(N: int | None =
None) ndarray Returns the impulse response \(h[n]\) of the FIR filter. The impulse response \(h[n]\) is the filter output when the input is an impulse \(\delta[n]\).
-
step_response(N: int | None =
None) ndarray Returns the step response \(s[n]\) of the FIR filter. The step response \(s[n]\) is the filter output when the input is a unit step \(u[n]\).
- frequency_response(...) tuple[numpy.ndarray, numpy.ndarray]
Returns the frequency response \(H(\omega)\) of the FIR filter.
- frequency_response_log(...) tuple[numpy.ndarray, numpy.ndarray]
Returns the frequency response \(H(\omega)\) of the FIR filter on a logarithmic frequency axis.
Properties
- property method : 'kaiser' | 'linear' | 'zoh' | 'custom'
The method used to design the multirate filter.
- property polyphase_taps : ndarray
The polyphase feedforward taps \(h_{i, j}\).
- property delay : int
The delay of the FIR filter \(d = \lfloor \frac{N + 1}{2} \rfloor\) in samples.